Lesson 11 - Portfolio Creation
Learn how to create your portfolio to level up your job search game
Estimated Read Time: 1,5 - 2 Hours
Learning Goals
In this lesson, you will learn:
Personal Brand:
- Create a polished, shareable portfolio showcasing your analytical capabilities
Video 1: Building a compelling portfolio
When it comes to landing a job, a well-managed portfolio can be just as valuable as any certification or degree because it stands as proof of your skills. In the previous lessons, you took your first steps toward building a portfolio by setting creating a showcase of what you can do with Tableau and Stakeholder Communication. In this lesson, you’ll begin compiling the deliverables from your cliqz project in one place and create “case studies” for your course projects that will form the foundation of your data analytics portfolio.
Hiring managers will be looking for evidence of your technical skills. However, the term “technical skills” doesn’t just refer to your ability to use tools such as Excel and Tableau or programming languages like SQL and Python, but also your analytical skills. Can you source, clean, and merge data? Can you segment data? Can you extract the data you need from a database? On top of that, recruiters will be looking for “soft skills” relating to communication and collaboration. That means translating business problems into analytics questions, communicating with stakeholders, and presenting your results in formats suitable for different audiences.
The project that you’ve worked on in this module was designed to ensure you have the key skills listed above. But it falls to you to curate and organize your portfolio in a way that demonstrates these skills to employers.
1. Portfolio Project Case Studies
Employers want to see how you approach a project from start to finish. One way to show them this is by creating case studies for each of your projects, detailing the ins and outs of each project in a way that’s easy to digest.
Each of your project case studies needs to start with the premise for your project and end with your results. You can then select the elements of each project that highlight key skills and competencies and detail the approach you took to get from A to B.
Developing these case studies will require you to tell a story about each project. This is a bit different from the stories you crafted for your projects as you worked through this module. The intended audience for those reports and presentations was always project stakeholders. The audience for the stories you’ll develop for your portfolio project case studies is potential employers.
The audience of your portfolio is your potential employer – not the Cliqz CEO!
For this reason, your portfolio project case studies need to demonstrate not only your competence at conducting analyses but also your non-technical skills (communication, collaboration, etc.) and how you approach your work. Let’s walk through an outline you can use to structure your case studies, followed by a closer look at the components that make up each case study.
2. Content Structuring
There are multiple ways to structure your case studies. Here we present three of them:
- STAR Framework
- Beginning-Middle-End Structure
- 5-step Framework
2.1. Using the STAR Method to Showcase Your Case Study
When you present your work in a portfolio, you’re not just showing that you know Tableau. You’re showing that you can solve problems that matter to the business. One of the best ways to do this is the STAR framework (Situation, Task, Action, Result).
This structure comes from behavioral interviews, but it works beautifully for data case studies too. It forces you to cut the fluff, highlight what matters, and speak in business language.
How STAR Works in Data Case Studies
- Situation – Set the business context. What was the company facing? Why did the analysis matter?
- Task – Define the analytical question or challenge you needed to answer.
- Action – Explain how you approached it: methods, data, tools (without drowning in technical detail).
- Result – Share the outcome: key insights, impact, or business recommendations.
Why STAR Works for Portfolios?
- Clear & concise: recruiters can skim and immediately get the story.
- Business-oriented: focuses on outcomes, not just formulas.
- Transferable: the same STAR case study can be used in a portfolio, LinkedIn post, or an interview answer.
2.2. Beginning-Middle-End Structure
Another way to tell your story is to use the following outline as a guide for structuring your case study:
- Beginning
- Middle
- End
Case studies are about how you approached each project, so you’ll need to use your own words
Beginning
Start by summarizing your project for the reader. This summary should include the project goals, information about the data set(s) and tools used, plus any analytical techniques that will stand out to recruiters.
Middle
The middle is the meat of your story and where you can go into detail about how you solved the problem presented to you. How did you go about finding a solution for the project? What process did you go through and why? Which technologies, methodologies, and skills did you use?
Outline the different stages of the project, explaining what you did at each stage and why. You don’t have to follow a linear progression. If you encountered any challenges or roadblocks as you worked through the analysis, explain what they were and how you either solved them or changed direction.
Provide the reader with supporting information, like a link to your Tableau storyboard and your video presentation . If you have code / data stored on a GitHub repository, sharing them can help communicate these stages. Or, if a key result led to a shift in your approach, a visual of this result, such as a graph or table, and a supporting explanation will help walk the viewer through your journey.
Share the insights and key findings and use supporting graphs and tables.
End
Wrap things up by sharing the recommendations of your analysis. Include your final project deliverables (e.g., storyboard, presentation), the main things you learned from the project, and what you might do differently or improve upon next time.
2.3. 5-step Framework
Structure your portfolio with these 5 sections:
1. Executive Summary (3-4 sentences)
- The business challenge Cliqz faces
- Your analytical approach
- Top 2 recommendations with potential impact
2. Business Challenge (1 paragraph)
- Context: Cliqz market position and user analytics
- Specific question: “How can cliqz increase user base?” or “How can cliqz improve search quality?”
3. Data & Methodology (2-3 bullet points)
- Data sources used
- Key analytical techniques applied
- Tools utilized (Tableau, Storytelling, etc.)
4. Key Insights (3 findings maximum)
- Each insight with supporting visual
- Quantified impact where possible
- Clear, business-focused language
5. Recommendations (2-3 actionable items)
- Specific strategies for implementation
- Expected outcomes/ROI estimates
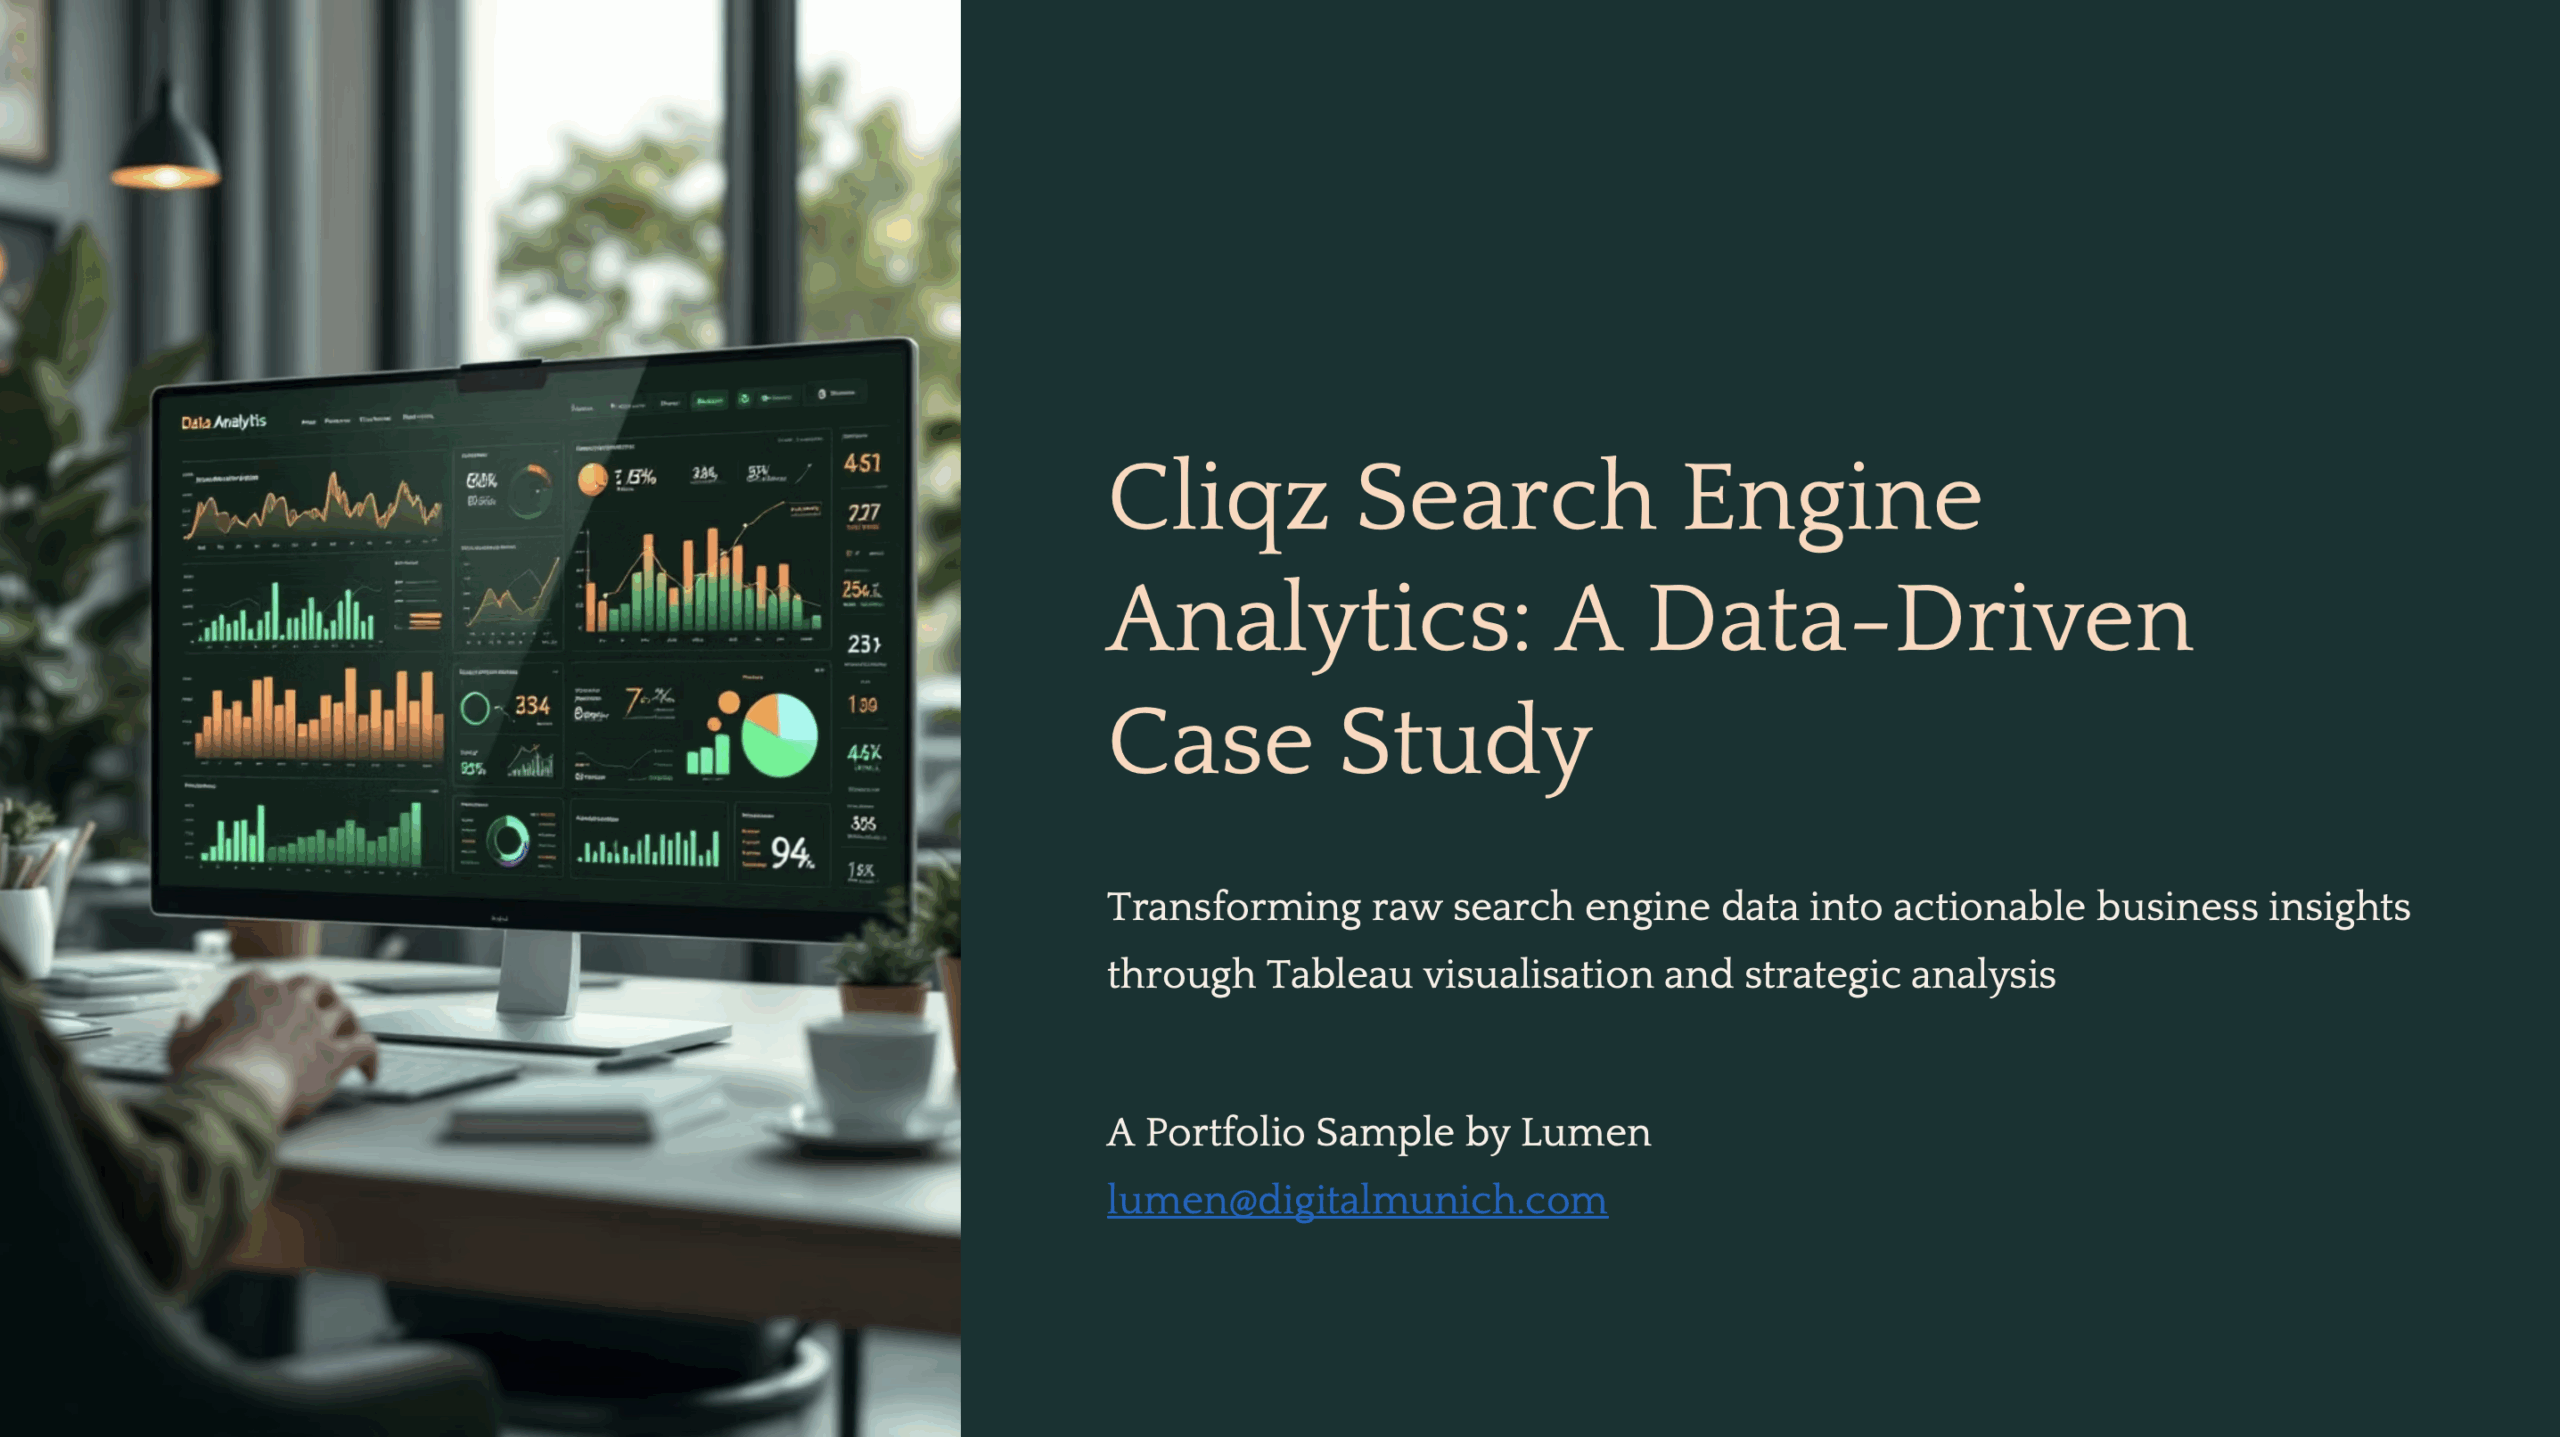
Consider this sample portfolio deck created for cliqz search analysis.
Note that this deck was created partially with the help of AI (some hypothetical statements / values might get in).
3. Portfolio Tips
Remember, you’ll be using your portfolio to market yourself for jobs, so how you present yourself and your work is important. Here are a few tips:
- Be Concise: Don’t overwhelm the reader with text. Keep your case studies concise and include only essential information.
- Proofread Your Work: Correct any formatting, spelling, or grammatical errors in your projects and case studies. Ask someone else to proofread and edit your work.
- Include Eye-Catching Imagery: No portfolio would be complete without compelling graphics demonstrating your ability to tell your project’s story. Select the best visuals you’ve created for each project and add them to your case studies. Your images—especially graphs and other data outputs—should be clearly labeled and accompanied by a short description for potential employers.
Example Portfolio
To see what a portfolio from a real data professional looks like, check out this Portfolio Website.
For a more detailed walkthrough of best practices when it comes to data analyst portfolios, check out this video guide:
4. AI Usage for Portfolio Creation
As the digital age unfolds, data analytics students and budding professionals increasingly use AI in their work. At first glance, these tools promise efficiency, accuracy, and assistance. But with these benefits comes the temptation to over-rely on AI. So, how can you represent your AI-aided work in a portfolio ethically and responsibly?
4.1. Honesty is the Best Policy
For a data analytics student like yourself, using an AI tool could mean getting quick answers to complex problems. But if you present those solutions as entirely your own in a portfolio, are you genuinely representing your skillset and knowledge?
The truth is, this challenge is not unique to AI — students and professionals alike have often relied on external sources to solve problems. Using forums like Stack Overflow or open-source code on GitHub is a key skill in and of itself! That said, in academia and professional settings, plagiarism is not tolerated, and the same principles apply to AI assistance. While AI can offer solutions, interpretations, or insights, you should clearly distinguish between AI-generated content and content you crafted yourself.
When adding work to your portfolio, here are some tips to remain transparent:
- Credit AI Tools: Be clear if you used an AI tool to help with your projects or analyses. It doesn’t diminish your work; it shows you can use cutting-edge resources effectively.
- Document the Process: Explain the steps you took, the challenges you faced, and how you employed AI. This offers a holistic view of your skillset, including problem-solving and critical thinking.
- Showcase Original Work: Balance out AI-assisted work with independent projects to demonstrate your foundational skills.
4.2. Ethical Implications for the Future
AI tools are revolutionizing how data analytics students and professionals approach their work. As they become better integrated, the line between AI assistance and individual effort may blur. However, the ethics of honest representation will always be clear-cut. Misrepresenting AI-generated work as your own is not only a disservice to yourself but also to potential employers or educators seeking to understand your capabilities. By committing to transparent representation, you can use AI responsibly and honestly. Embrace AI, but let your ethics guide your narrative.
5. Platform Selection for Portfolio Sharing
Choose your portfolio platform based on your comfort level and goals:
Option A: LinkedIn Articles (Easiest)
- Pros: Built-in professional audience, easy sharing, no technical setup
- Cons: Limited formatting options, LinkedIn-only visibility, individual projects only – no comprehensive portfolio.
- Best for: Quick deployment, immediate professional network access
Option B: GitHub Pages (Free website)
- Pros: Professional web presence, customizable, shows tech comfort
- Cons: Requires basic HTML/markdown knowledge
- Best for: Those comfortable with basic web tools, long-term portfolio building
Option C: Tableau Public (For data visualization focus)
- Pros: Interactive dashboards, impressive visual impact, industry-standard tool
- Cons: Requires recreating analysis in Tableau, public data only
- Best for: Showcasing advanced visualization skills
Option D: Google Sites/Wix/SquareSpace (User-friendly websites – limited free version available)
- Pros: Drag-and-drop interface, professional appearance, easy sharing
- Cons: May look template-based, limited customization
- Best for: Those wanting professional website without technical skills
Option E: PDF + File Sharing (Universal compatibility)
- Pros: Works everywhere, maintains formatting, easy to share via email/LinkedIn
- Cons: Static format, less interactive
- Best for: Traditional applications, email sharing, universal access
Recommendation:
Keeping in view the long-term vision, consider a simple website for long-term professional presence. If you want to start simple, go for a slide deck. Keep highlighting your projects in LinkedIn Featured Section.
Create your portfolio in multiple formats – LinkedIn Article for visibility, PDF for applications, and consider a simple website for long-term professional presence.
Summary
In this lesson, you learned:
- how to curate and structure your case studies into a professional portfolio using frameworks such as STAR or a Beginning–Middle–End narrative.
Exercise
Estimated Time to Complete: 2 hours
Task : Portfolio Creation
Transform Your Cliqz Analysis into a Professional Portfolio Showcase
In this task will see you build your portfolio based on the work you did in the complete Data Visualization And Storytelling Module, creating a case study for the Cliqz project. Starting work on your portfolio right now will give you a jumpstart in your job search after the course. It’s also a good opportunity for you to get feedback from your mentor on your entire portfolio of projects and how you present them.
- Continue with the platform that you chose to build your portfolio.
- For your cliqz project, write a story using any of the structures explained in the lesson: the STAR method, the “beginning,” “middle,” and “end” structure or the 5-step framework.
Tip!
Don’t overwhelm the reader with text; keep each section concise.
Remember, your audience is the hiring manager – not the Cliqz CEO.
- After you’ve written your story, choose the most striking visuals from your projects to display in your portfolio and add them to your slides/page. You can take these images from the presentations you’ve already created or take screenshots. Add a short description under each image to help others interpret your work.
- Include links to relevant supporting documents and files. For example, you should definitely include a link to the Tableau storyboard you created under Lesson 9 and the video your created under Lesson 10.
Submission Guidelines
Submit your solution as a slide deck or a link to your portfolio website.
Filename Format (in case of deck):
- YourName_Lesson11_Portfolio.pptx
When you’re ready, submit your completed exercise to the designated folder in OneDrive. Drop your mentor a note about submission.
Important: Please scan your files for viruses before uploading.
Submission & Resubmission Guidelines
- Initial Submission Format: YourName_Lesson#_…
- Resubmission Format:
- YourName_Lesson#_…_v2
- YourName_Lesson#_…_v3
- Rubric Updates:
- Do not overwrite original evaluation entries
- Add updated responses in new “v2” or “v3” columns
- This allows mentors to track your improvement process
Evaluation Rubric
| Criteria | Exceeds Expectations | Meets Expectations | Needs Improvement | Incomplete / Off-Track |
|---|---|---|---|---|
| Structure & Narrative | Case study is sharply structured (STAR, Beginning–Middle–End, or 5-step). Narrative flows seamlessly, is concise, and fully framed for a hiring manager. Clear context, process, insights, and recommendations are all present. | Case study follows a professional structure with clear flow. All required elements (context, process, insights, recommendations) are present and coherent. Strong readability, with polished strategic framing. | Case study is loosely structured, partially unclear, or missing one key element (e.g., context or recommendations). Reads more like notes than a professional showcase. | No coherent structure. Text is incomplete, confusing, or aimed at the wrong audience (e.g., Cliqz CEO instead of hiring manager), plagiarised or thoughtlessly AI-created without credits. |
| Visuals & Design | Portfolio includes 2–3 well-curated visuals that are clear, professional, and directly reinforce the story. Each has a precise caption that interprets findings. Layout is polished and recruiter-friendly. | Portfolio includes visuals that are relevant and support the story. Captions interpret the visuals. Layout is professional and clear. | Visuals are included but weakly chosen (cluttered, redundant, or unclear). Captions are vague or missing. Layout looks rushed. | No visuals, or visuals are irrelevant and copied without explanation. Layout is incomplete. |
| Supporting Evidence | Includes multiple supporting links (Lesson 11 presentation, Excel files, data). Links are functional, well-labeled, and add credibility. | Tableau Storyboard, Video presentation and dataset is linked and clearly labeled. Links work and add credibility. | Links are missing, broken, or minimally useful. | No supporting evidence provided. |
| Professional Framing | Case study reads as highly polished portfolio material. Tone is professional, concise, business-oriented, and free of unnecessary jargon. Includes clear title page + contact information. | Case study is professional and appropriately embedded in the portfolio. Tone is business-friendly, text is concise, and technical terms are explained. Title page + contact information included. | Case study is too text-heavy, overly technical, or not audience-appropriate. Title/contact info is incomplete. | Case study is unprofessional in tone, lacks contact info, or reads like raw notes. |
Got Feedback?
Contact
Talk to us
Have questions or feedback about Lumen? We’d love to hear from you.